Synchrotron Radiation (SR) is the electromagnetic radiation emitted along the tangent direction of the electron orbit by high-speed electrons moving in a circular accelerator when passing through a bending magnet. SR source, as a platform-type scientific and technological infrastructure, plays an important supporting role in the research and development of inorganic materials. SR techniques become an indispensable research tools of modern science and technology, and inorganic materials are one of the main application fields of SR techniques. Compared with conventional light source used for research, SR techniques in the study of inorganic materials have following obvious advantages: 1) higher obtained data qualities; 2) better spatial and temporal resolutions; 3) easier simulated in-situ and material service environment; 4) synchronously acquiring multi-scale, multi-faceted and multi-type structural information; 5) new means more likely to detect new structural characteristics. SR techniques help solve some key scientific problems in the field of inorganic materials, and greatly promote their research. Firstly, this paper briefly introduces the current status of SR sources and their three existing domestic SR facilities: Beijing Synchrotron Radiation Facility (BSRF), Shanghai Synchrotron Radiation Facility (SSRF), and National Synchrotron Radiation Laboratory (NSRL). Secondly, some application examples related to inorganic materials research are given from the four aspects of X-ray diffraction, scattering, spectroscopy and imaging. Finally, summary and prospect are given to the SR source, the structurally characterization techniques, and their application in inorganic materials.
LIU Yunpeng, SHENG Weifan, WU Zhonghua. Synchrotron Radiation and Its Applications Progress in Inorganic Materials. Journal of Inorganic Materials, 2021, 36(9): 901-918 DOI:10.15541/jim20200703
Fig. 1
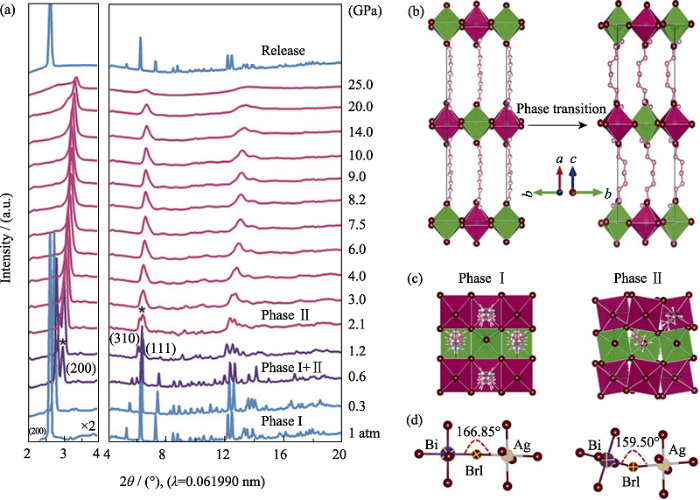
In situ high pressure XRD patterns of (BA)4AgBiBr8 and schematic illustration of crystal structure changes[33]
(a) Representative XRD patterns of (BA)4AgBiBr8 at selected pressures up to 25.0βGPa. The magnification factor of the peak intensities in the left panel is two times that of the right panel; (b) Crystal structure of (BA)4AgBiBr8 perpendicular to the c axis (perpendicular to a axis, phase II). Pink and green octahedra represent [AgBr6]5- and [BiBr6]3- octahedra, respectively; (c) Crystal structures of (BA)4AgBiBr8 along (100) ((001), Phase II) with increasing pressure. Ag-Br octahedra are shown in pink. Bi-Br octahedral are shown in green; (d)βIllustrations of Bi-Br1-Ag bond angle within the inorganic layers framework before and after the phase transition. (1 atm=1.01×10⁵ Pa)
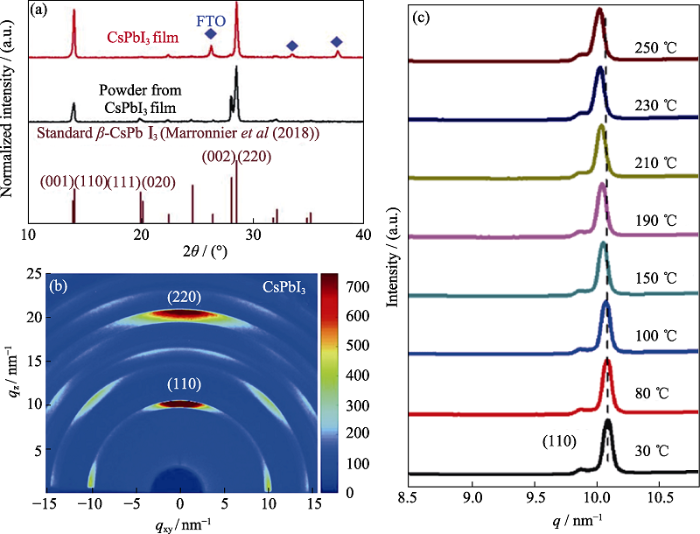
(a) XRD patterns acquired from a CsPbI3 thin film and powders scratched from its films. Brown lines indicate the standard β-CsPbI3 XRD pattern calculated for Cu Kα1 radiation for the tetragonal perovskite structure at 518 K; (b) GIWAXS data from β-CsPbI3 films; (c) Azimuthally integrated intensity profiles for the β-CsPbI3 perovskite films annealed at different temperatures (30, 80, 100, 150, 190, 210, 230, 250 ℃)
Fig. 4
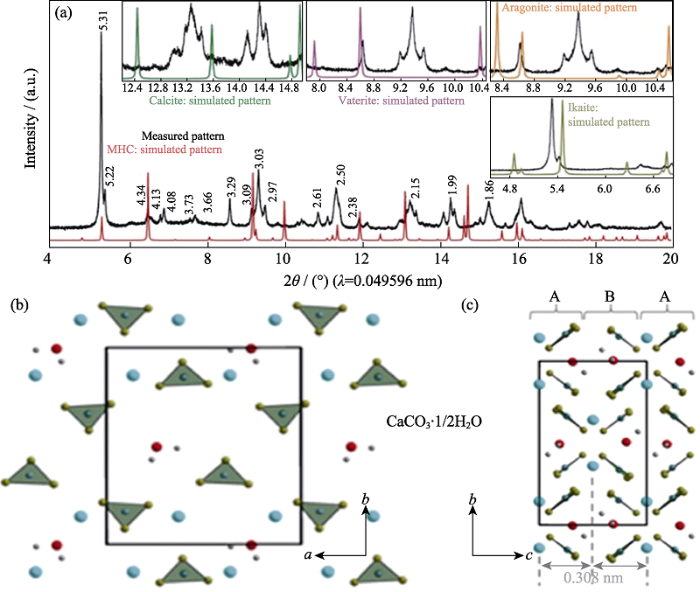
High-resolution SR-XRD pattern of CaCO3·1/2H2O and its crystal structure model[9]
(a) Synchrotron HRXRPD pattern of CaCO3·1/2H2O using a wavelength of 0.049596 nm; (b) The layers of CaCO3·1/2H2O consist of Ca(μ2-CO3)2/5(μ1-CO3)3/5(H2O)1/2 double zigzag chains running along the a axis, here, differently oriented (up and down) carbonate groups are indicated by indices μ2 and μ1; (c) Stacking in the c direction occurs in a conventional ABAB fashion with an interlayer spacing (the distance between Ca planes) equal to 0.308 nm. The insets in (a) show comparisons of the measured HRXRPD pattern of CaCO3·1/2H2O with simulated patterns of other calcium carbonate phases. Different types of atoms are colored as follows: Ca, blue; carbonate group, green; oxygen from water, red; and hydrogen, gray
Fig. 7
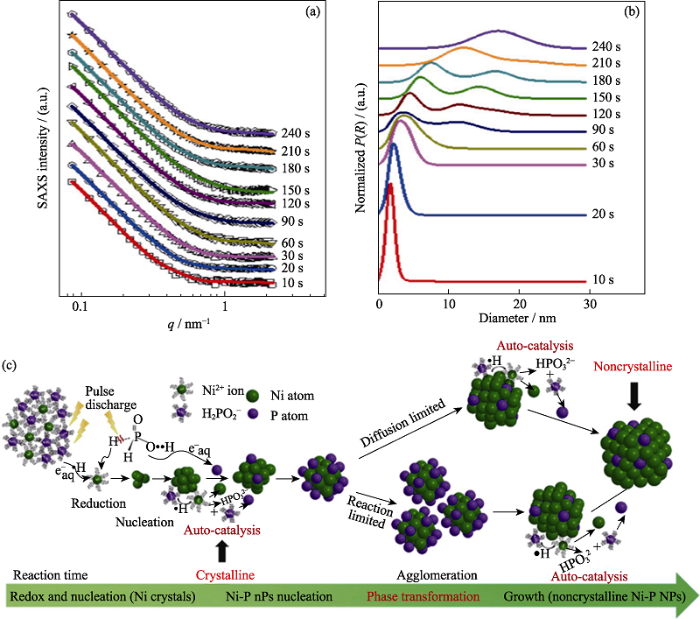
Time-resolved SAXS results and schematic illustration of the formation mechanism for NiP[46]
(a) Comparison between the experimental SAXS intensities (symbols) and the simulated ones (solid lines); (b) Normalized particle-volume distribution P(R) extracted from the SAXS data; (c) Schematic map of the formation mechanism of noncrystalline Ni-P nanoparticles
Fig. 8
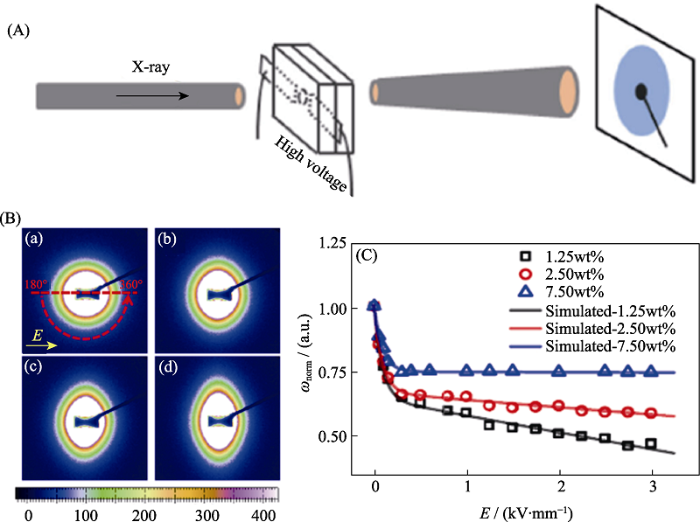
In-situ SAXS technique applied on the study for the orientation of suspended Na2Ti3O7 nanofiber induced by applied electric field[47]
(A) Sketch map of in-situ SAXS measurements; (B) SAXS patterns of the silicone oil suspension with 1.25wt% of Na2Ti3O7 nanofibers under the DC electric-field strength: 0 kV/mm (a), 0.5 kV/mm (b), 1.5 kV/mm (c), and 2.5 kV/mm (d); (C) Electric-field strength dependence of normalized orientation distribution width, the solid lines represent the simulation
Fig. 9
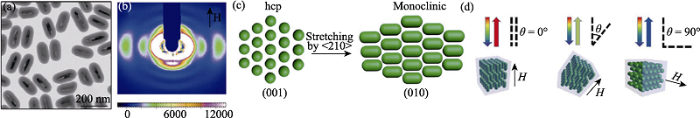
Structural evolution of Fe3O4@SiO2 nanorods under magnetic field studied by SAXS[48]
(a) TEM image of the Fe3O4@SiO2 nanorods; (b) Small-angle X-ray diffraction pattern of an aqueous suspension of Fe3O4@SiO2 nanorods (volume fraction ϕ=21%) in the presence of a 200-Gauss external magnetic field, the color bar on the bottom shows the relative diffraction intensity; (c) Schematic illustration of the stretching of the hcp lattice along the <210> direction. The (001) facet of the original hcp lattice was transformed into the (010) facet of the new monoclinic structure. The main axis of nanorods is aligned along the <201> direction of the monoclinic lattice, which is parallel to external magnetic fields; (d) Schematic illustration of magnetically tuning the Bragg diffractions from crystalline colloidal array by changing the angle (θ) between the magnetic field and the incident light
Fig. 10
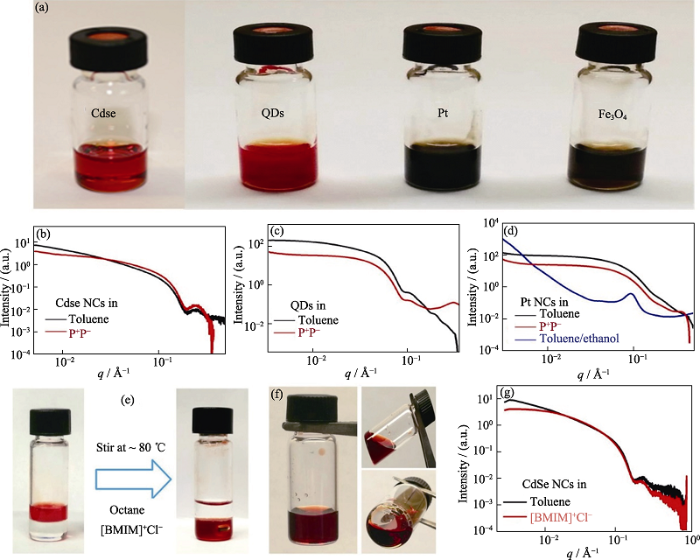
Experimental evidence for the stable presence of nanoparticles in molten inorganic salts provided by SAXS technique[49]
(a) Photographs of stable nanocrystals (NC) colloids in P+P-; (b-d) Small-angle X-ray scattering (SAXS) patterns of CdSe (b), quantum dots (QDs) (c) and Pt NCs (d) in toluene and P+P-. The SAXS patterns of NCs in P+P- resemble those of NCs in toluene, indicating high NC colloidal stability; (e) Photographs showing the phase transfer of CdSe NCs from octane to [BMIM]+Cl- without additional ligands; (f) Photographs of stable CdSe NC colloids in [BMIM]+Cl-; (g) SAXS patterns of CdSe NCs in toluene (with OA/TOP/TOPO) and [BMIM]+Cl-. All samples were gently heated to keep [BMIM]+Cl- in the molten state (1 Å=0.1 nm)
Fig. 11
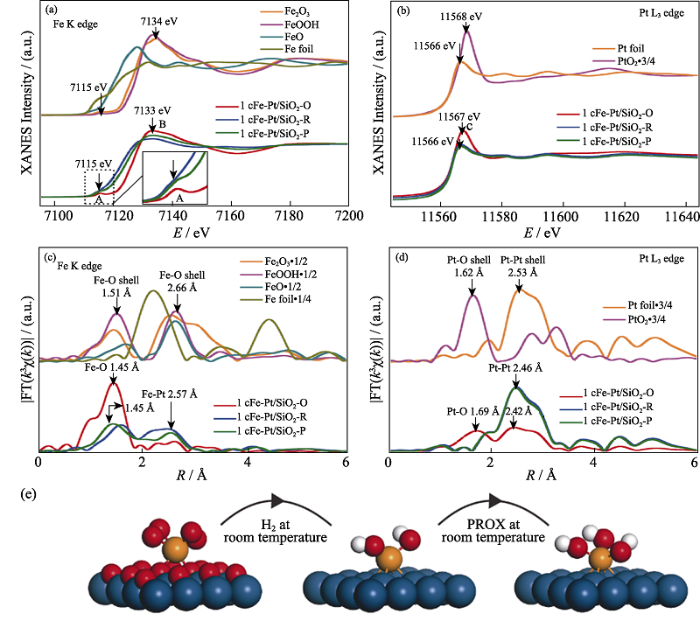
In situ XAFS measurements of the 1cFe-Pt/SiO2 catalyst and its schematic illustration of catalytic mechanism[54]
(a-d) XANES spectra at Fe K edge (a) and Pt L3 edge (b), detailed structural information shown in the k3-weighted FT spectra in R-space at the Fe K edge (c) and the Pt L3 edge (d) (E: energy, R: distance between absorbing atom and neighbouring scatterer atoms, without correcting for scattering phase shift, and χ(k): the amplitude of the EXAFS oscillations as a function of photoelectron wavenumber k (a.u., arbitrary units). The inset in (a) shows a magnified view of the pre-edge peak A. The energy positions of Fe pre-edge peak A, Fe white-line peak B and Pt white-line peak C, as well as R-space peak positions of the shells of Fe-O, Fe-Fe, Fe-Pt, Pt-O and Pt-Pt, are also shown; (e) Schematic models of 1cFe-Pt/SiO2-O (left), 1cFe-Pt/SiO2-R (middle) and 1cFe-Pt/SiO2-P (right), Fe, O, H and Pt atoms are shown in orange, red, white, and blue, respectively. (1 Å=0.1 nm) (colorful figures are available on website)
Fig. 12
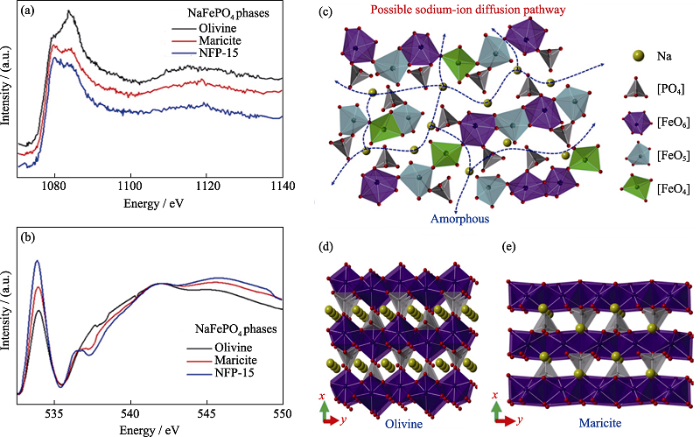
XAFS spectra of NaFePO4 and schematic illustrations for Na diffusive mechanism[55]
X-ray absorption near edge structure spectra of Na K-edge (a), O K-edge (b) for olivine-type, maricite-type and polymorphic composites obtained by milling for 15 h (NFP-15); Schematic illustrations for Na diffusive mechanism: possible sodium-ion diffusive pathways and atomistic structure for amorphous NaFePO4 (c), structural sketching diagrams of olivine-type NaFePO4 (d), and maricite-type NaFePO4 (e) Colorful figures are available on website
Fig. 14
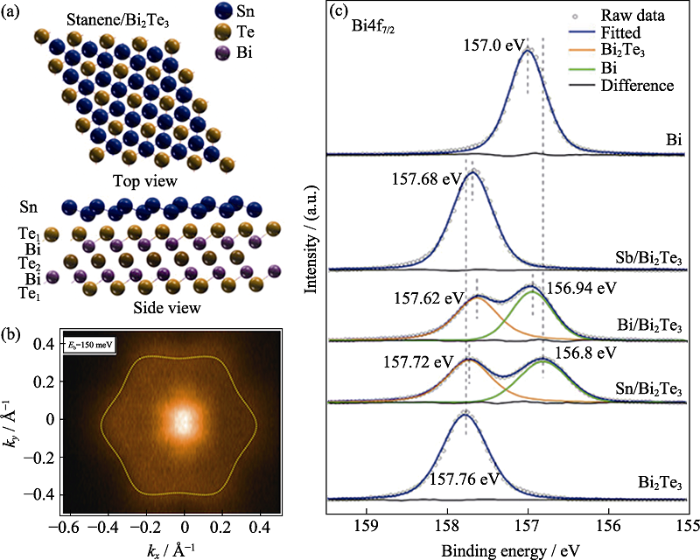
Electronic structure and interfacial interaction of 2D Sn/Bi2Te3 material studied by SR-XRS[59]
(a) Perspective top and side views of atomic structure of stanene/Bi2Te3; (b) ARPES intensity evolution of CE contours in the 2D Brillouin zone at the specified binding energies; (c) XPS results of Bi4f7/2 core levels. The Bi4f7/2 spectra are measured at 500 eV under room temperature (1 Å=0.1 nm) (colorful figures are available on website)
Fig. 15
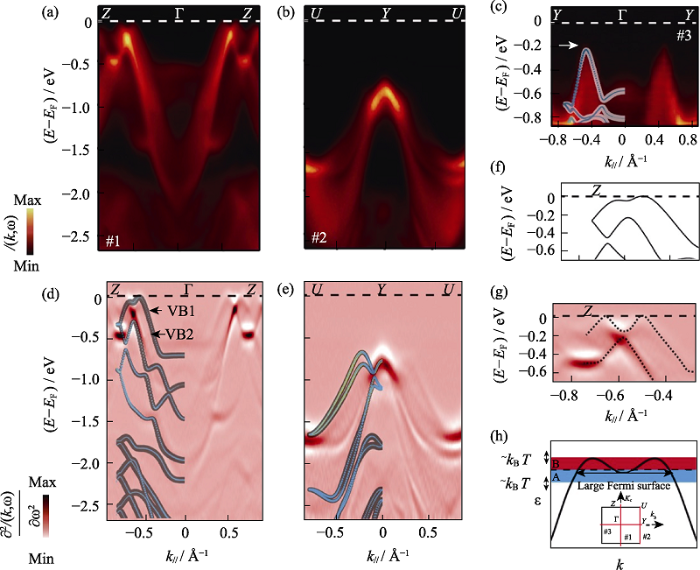
Electronic structure of p-SnSe resolved by ARPES[60]
ARPES measures band dispersions along high-symmetry directions of Z-Γ-Z (a), U-Y-U (b), and Y-Γ-Y (c), taken with 50 eV photon energy. The second derivative plots (d) and (e), corresponding to (a) and (b), respectively, directly compared with the DFT calculations, in which the weight of Sn5s and Se4p orbitals are represented by light blue and yellow, respectively; Close-up of the top VBs along Γ-Z reveals pronounced differences between the theoretical band dispersion (f) and the ARPES measured results (g), as highlighted by the X-shaped dashed lines; (h) Schematic plot of a pudding-moul shaped VB with corrugations, which leads to giant S due to the band geometry effect with inset showing the ARPES cut directions in the projected two-dimensional first Brillouin zone (BZ) (1 Å=0.1 nm)
Fig. 16
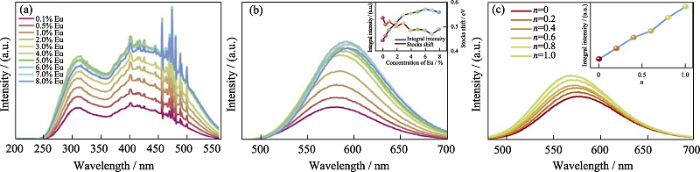
Persistent luminescence properties of CaSi10-nAl2+nOnN16-n:xEu2+ material studied by VUV-UV spectra[61]
(a) Excitation and (b) emission spectra of CaSi10Al2N16: xEu (x = 0.1%-8%) samples with inset showing the integral intensity (blue curve) and the Stokes shift (red curve) of those samples against Eu concentration (the sharp peaks in the range of 400-500 nm being caused by the Xe lamp equipped in the FLS 920 spectrophotometer); (c) Emission spectra of CaSi10-nAl2+nOnN16-n: 0.5%Eu (n=0-1) samples with inset showing the integral intensity versus n values (colorful figures are avaailable on websites)
Fig. 17
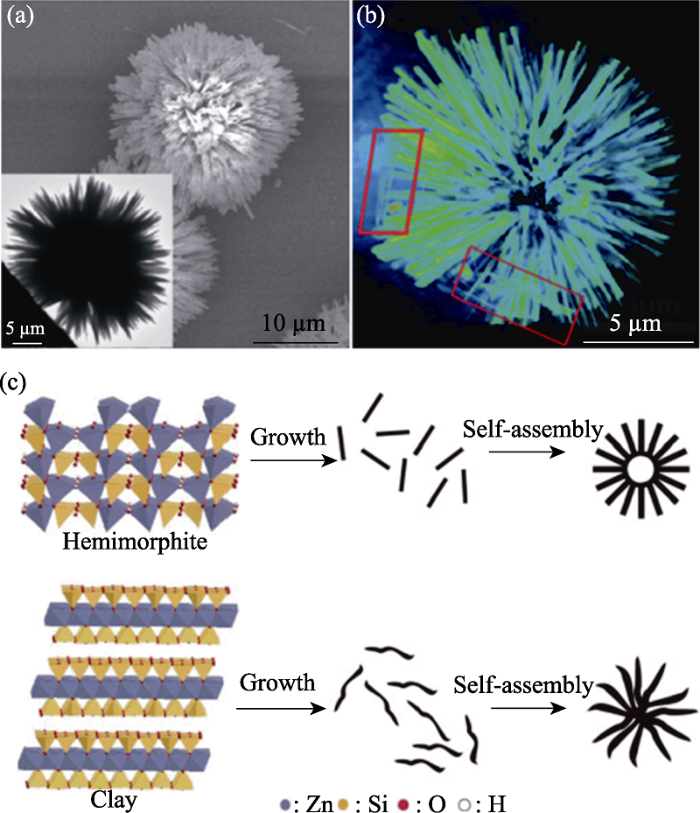
Structural defects and formation process of Zn4Si2O7(OH)2·H2O particles studied by SR-XRI[66]
(a) SEM image (inset: TEM image); (b) Reconstructed three dimensional rendering view of the urchin-like zinc silicate; (c) Schematic illustration of the preparation of the zinc silicate nanomaterials
Fig. 18
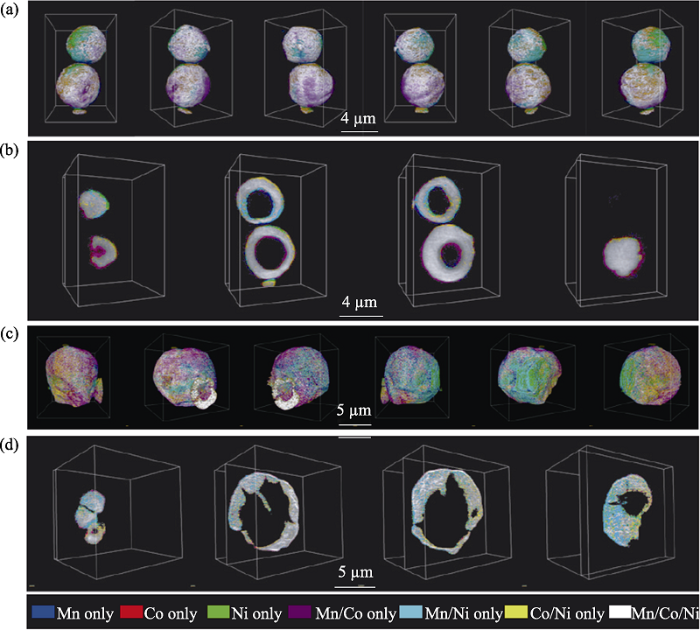
3D element distribution of particles analyzed by X-ray tomography technique[67]
Elemental association maps of the as-made NMC precursor after spray pyrolysis (a,b) and the powder after annealing at 850 ℃ (c,d); 3D rendering of the elemental associations viewing the particles at different angles (a,c); 2D slices of the elemental associations cut through at different depths of the imaged particles (b,d). The colours representing the elemental associations are shown at the bottom
Fig. 19
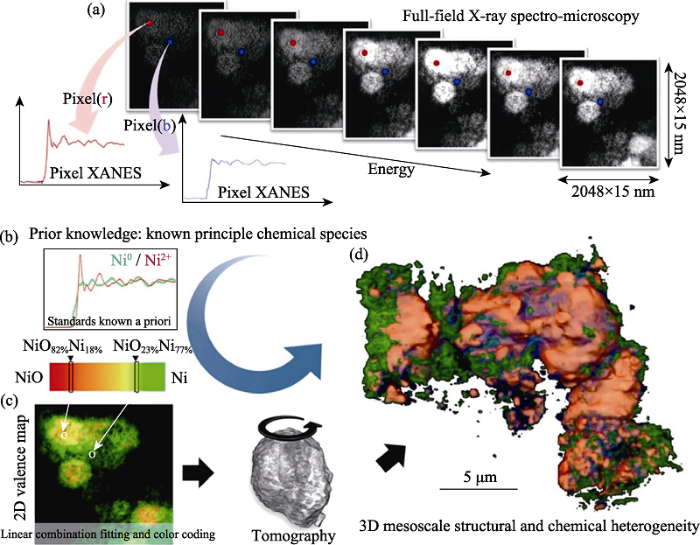
3D distributions of chemical components and valence states of LiNi0.4Mn0.4Co0.2O2 battery particles studied by X-ray spectro-microscopy[68]
(a) Panel illustrating the data structure; (b) Panel showing the prior knowledge of a list of anticipated principal chemical species in the sample, which is indispensable for the chemical mapping in this approach. Panel (c) illustrates the quantification procedures including the linear combination fitting, the color coding, and the tomographic reconstruction. Panel (d) shows the 3D mesoscale structural and chemical heterogeneity of a cluster of partially reduced NiO electrode particles
In-situ time-resolved X-ray absorption fine structure and small angle X-ray scattering revealed an unexpected phase structure transformation during the growth of nickel phosphide nanoparticles
The Journal of Physical Chemistry C, 2018, 122(28):16397-16405.
Molecular-level insight into selective catalytic reduction of NOx with NH3 to N2 over a highly efficient bifunctional Va-MnOx catalyst at low temperature
... [9] High-resolution SR-XRD pattern of CaCO<sub>3</sub>·1/2H<sub>2</sub>O and its crystal structure model<sup>[<xref ref-type="bibr" rid="b9">9</xref>]</sup>
(a) Synchrotron HRXRPD pattern of CaCO3·1/2H2O using a wavelength of 0.049596 nm; (b) The layers of CaCO3·1/2H2O consist of Ca(μ2-CO3)2/5(μ1-CO3)3/5(H2O)1/2 double zigzag chains running along the a axis, here, differently oriented (up and down) carbonate groups are indicated by indices μ2 and μ1; (c) Stacking in the c direction occurs in a conventional ABAB fashion with an interlayer spacing (the distance between Ca planes) equal to 0.308 nm. The insets in (a) show comparisons of the measured HRXRPD pattern of CaCO3·1/2H2O with simulated patterns of other calcium carbonate phases. Different types of atoms are colored as follows: Ca, blue; carbonate group, green; oxygen from water, red; and hydrogen, gray ...
... [9]
(a) Synchrotron HRXRPD pattern of CaCO3·1/2H2O using a wavelength of 0.049596 nm; (b) The layers of CaCO3·1/2H2O consist of Ca(μ2-CO3)2/5(μ1-CO3)3/5(H2O)1/2 double zigzag chains running along the a axis, here, differently oriented (up and down) carbonate groups are indicated by indices μ2 and μ1; (c) Stacking in the c direction occurs in a conventional ABAB fashion with an interlayer spacing (the distance between Ca planes) equal to 0.308 nm. The insets in (a) show comparisons of the measured HRXRPD pattern of CaCO3·1/2H2O with simulated patterns of other calcium carbonate phases. Different types of atoms are colored as follows: Ca, blue; carbonate group, green; oxygen from water, red; and hydrogen, gray ...
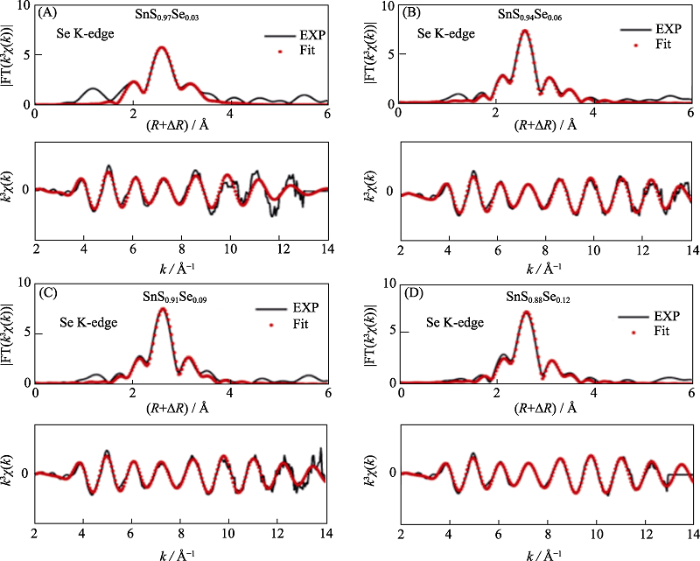
High thermoelectric performance in low-cost SnS0.91Se0.09 crystals
... [11] Relevant SR-XRD patterns of <i>β</i>-CsPbI<sub>3</sub><sup>[<xref ref-type="bibr" rid="b11">11</xref>]</sup>
(a) XRD patterns acquired from a CsPbI3 thin film and powders scratched from its films. Brown lines indicate the standard β-CsPbI3 XRD pattern calculated for Cu Kα1 radiation for the tetragonal perovskite structure at 518 K; (b) GIWAXS data from β-CsPbI3 films; (c) Azimuthally integrated intensity profiles for the β-CsPbI3 perovskite films annealed at different temperatures (30, 80, 100, 150, 190, 210, 230, 250 ℃) ...
... [11]
(a) XRD patterns acquired from a CsPbI3 thin film and powders scratched from its films. Brown lines indicate the standard β-CsPbI3 XRD pattern calculated for Cu Kα1 radiation for the tetragonal perovskite structure at 518 K; (b) GIWAXS data from β-CsPbI3 films; (c) Azimuthally integrated intensity profiles for the β-CsPbI3 perovskite films annealed at different temperatures (30, 80, 100, 150, 190, 210, 230, 250 ℃) ...
Structure and properties of nanocrystalline materials
... [33] <i>In situ</i> high pressure XRD patterns of (BA)<sub>4</sub>AgBiBr<sub>8</sub> and schematic illustration of crystal structure changes<sup>[<xref ref-type="bibr" rid="b33">33</xref>]</sup>
(a) Representative XRD patterns of (BA)4AgBiBr8 at selected pressures up to 25.0βGPa. The magnification factor of the peak intensities in the left panel is two times that of the right panel; (b) Crystal structure of (BA)4AgBiBr8 perpendicular to the c axis (perpendicular to a axis, phase II). Pink and green octahedra represent [AgBr6]5- and [BiBr6]3- octahedra, respectively; (c) Crystal structures of (BA)4AgBiBr8 along (100) ((001), Phase II) with increasing pressure. Ag-Br octahedra are shown in pink. Bi-Br octahedral are shown in green; (d)βIllustrations of Bi-Br1-Ag bond angle within the inorganic layers framework before and after the phase transition. (1 atm=1.01×10⁵ Pa) ...
... [33]
(a) Representative XRD patterns of (BA)4AgBiBr8 at selected pressures up to 25.0βGPa. The magnification factor of the peak intensities in the left panel is two times that of the right panel; (b) Crystal structure of (BA)4AgBiBr8 perpendicular to the c axis (perpendicular to a axis, phase II). Pink and green octahedra represent [AgBr6]5- and [BiBr6]3- octahedra, respectively; (c) Crystal structures of (BA)4AgBiBr8 along (100) ((001), Phase II) with increasing pressure. Ag-Br octahedra are shown in pink. Bi-Br octahedral are shown in green; (d)βIllustrations of Bi-Br1-Ag bond angle within the inorganic layers framework before and after the phase transition. (1 atm=1.01×10⁵ Pa) ...
A high-capacity O2-type Li-rich cathode material with a single-layer Li2MnO3 superstructure
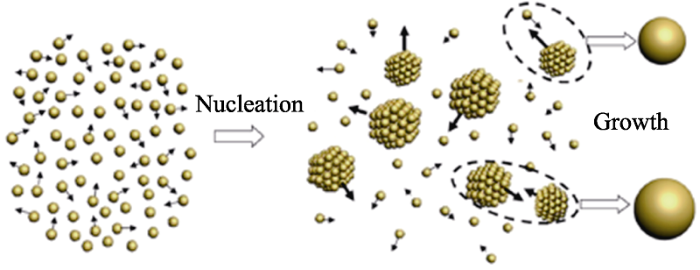
... [45] Sketch of the growth process of PVP-coated silver nanoparticles<sup>[<xref ref-type="bibr" rid="b45">45</xref>]</sup>Fig. 6
为了解析Ag花生状纳米颗粒的结构, 该研究还首次导出了其回转半径(l)的表达式如下: ...
... [45] Fig. 6
为了解析Ag花生状纳米颗粒的结构, 该研究还首次导出了其回转半径(l)的表达式如下: ...
In-situ time-resolved X-ray absorption fine structure and small angle X-ray scattering revealed an unexpected phase structure transformation during the growth of nickel phosphide nanoparticles
... [46] Time-resolved SAXS results and schematic illustration of the formation mechanism for NiP<sup>[<xref ref-type="bibr" rid="b46">46</xref>]</sup>
(a) Comparison between the experimental SAXS intensities (symbols) and the simulated ones (solid lines); (b) Normalized particle-volume distribution P(R) extracted from the SAXS data; (c) Schematic map of the formation mechanism of noncrystalline Ni-P nanoparticles ...
... [46]
(a) Comparison between the experimental SAXS intensities (symbols) and the simulated ones (solid lines); (b) Normalized particle-volume distribution P(R) extracted from the SAXS data; (c) Schematic map of the formation mechanism of noncrystalline Ni-P nanoparticles ...
Small-angle X-ray scattering study on the orientation of suspended sodium titanate nanofiber induced by applied electric field
... [47] <i>In-situ</i> SAXS technique applied on the study for the orientation of suspended Na<sub>2</sub>Ti<sub>3</sub>O<sub>7</sub> nanofiber induced by applied electric field<sup>[<xref ref-type="bibr" rid="b47">47</xref>]</sup>
(A) Sketch map of in-situ SAXS measurements; (B) SAXS patterns of the silicone oil suspension with 1.25wt% of Na2Ti3O7 nanofibers under the DC electric-field strength: 0 kV/mm (a), 0.5 kV/mm (b), 1.5 kV/mm (c), and 2.5 kV/mm (d); (C) Electric-field strength dependence of normalized orientation distribution width, the solid lines represent the simulation ...
... [47]
(A) Sketch map of in-situ SAXS measurements; (B) SAXS patterns of the silicone oil suspension with 1.25wt% of Na2Ti3O7 nanofibers under the DC electric-field strength: 0 kV/mm (a), 0.5 kV/mm (b), 1.5 kV/mm (c), and 2.5 kV/mm (d); (C) Electric-field strength dependence of normalized orientation distribution width, the solid lines represent the simulation ...
Single-stimulus-induced modulation of multiple optical properties
... [48] Structural evolution of Fe<sub>3</sub>O<sub>4</sub>@SiO<sub>2</sub> nanorods under magnetic field studied by SAXS<sup>[<xref ref-type="bibr" rid="b48">48</xref>]</sup>
(a) TEM image of the Fe3O4@SiO2 nanorods; (b) Small-angle X-ray diffraction pattern of an aqueous suspension of Fe3O4@SiO2 nanorods (volume fraction ϕ=21%) in the presence of a 200-Gauss external magnetic field, the color bar on the bottom shows the relative diffraction intensity; (c) Schematic illustration of the stretching of the hcp lattice along the <210> direction. The (001) facet of the original hcp lattice was transformed into the (010) facet of the new monoclinic structure. The main axis of nanorods is aligned along the <201> direction of the monoclinic lattice, which is parallel to external magnetic fields; (d) Schematic illustration of magnetically tuning the Bragg diffractions from crystalline colloidal array by changing the angle (θ) between the magnetic field and the incident light ...
... [48]
(a) TEM image of the Fe3O4@SiO2 nanorods; (b) Small-angle X-ray diffraction pattern of an aqueous suspension of Fe3O4@SiO2 nanorods (volume fraction ϕ=21%) in the presence of a 200-Gauss external magnetic field, the color bar on the bottom shows the relative diffraction intensity; (c) Schematic illustration of the stretching of the hcp lattice along the <210> direction. The (001) facet of the original hcp lattice was transformed into the (010) facet of the new monoclinic structure. The main axis of nanorods is aligned along the <201> direction of the monoclinic lattice, which is parallel to external magnetic fields; (d) Schematic illustration of magnetically tuning the Bragg diffractions from crystalline colloidal array by changing the angle (θ) between the magnetic field and the incident light ...
... [49] Experimental evidence for the stable presence of nanoparticles in molten inorganic salts provided by SAXS technique<sup>[<xref ref-type="bibr" rid="b49">49</xref>]</sup>
(a) Photographs of stable nanocrystals (NC) colloids in P+P-; (b-d) Small-angle X-ray scattering (SAXS) patterns of CdSe (b), quantum dots (QDs) (c) and Pt NCs (d) in toluene and P+P-. The SAXS patterns of NCs in P+P- resemble those of NCs in toluene, indicating high NC colloidal stability; (e) Photographs showing the phase transfer of CdSe NCs from octane to [BMIM]+Cl- without additional ligands; (f) Photographs of stable CdSe NC colloids in [BMIM]+Cl-; (g) SAXS patterns of CdSe NCs in toluene (with OA/TOP/TOPO) and [BMIM]+Cl-. All samples were gently heated to keep [BMIM]+Cl- in the molten state (1 Å=0.1 nm) ...
... [49]
(a) Photographs of stable nanocrystals (NC) colloids in P+P-; (b-d) Small-angle X-ray scattering (SAXS) patterns of CdSe (b), quantum dots (QDs) (c) and Pt NCs (d) in toluene and P+P-. The SAXS patterns of NCs in P+P- resemble those of NCs in toluene, indicating high NC colloidal stability; (e) Photographs showing the phase transfer of CdSe NCs from octane to [BMIM]+Cl- without additional ligands; (f) Photographs of stable CdSe NC colloids in [BMIM]+Cl-; (g) SAXS patterns of CdSe NCs in toluene (with OA/TOP/TOPO) and [BMIM]+Cl-. All samples were gently heated to keep [BMIM]+Cl- in the molten state (1 Å=0.1 nm) ...
Probing nucleation pathways for morphological manipulation of platinum nanocrystals
Molecular-level insight into selective catalytic reduction of NOx with NH3 to N2 over a highly efficient bifunctional Va-MnOx catalyst at low temperature
... [54] <i>In situ</i> XAFS measurements of the 1cFe-Pt/SiO<sub>2</sub> catalyst and its schematic illustration of catalytic mechanism<sup>[<xref ref-type="bibr" rid="b54">54</xref>]</sup>
(a-d) XANES spectra at Fe K edge (a) and Pt L3 edge (b), detailed structural information shown in the k3-weighted FT spectra in R-space at the Fe K edge (c) and the Pt L3 edge (d) (E: energy, R: distance between absorbing atom and neighbouring scatterer atoms, without correcting for scattering phase shift, and χ(k): the amplitude of the EXAFS oscillations as a function of photoelectron wavenumber k (a.u., arbitrary units). The inset in (a) shows a magnified view of the pre-edge peak A. The energy positions of Fe pre-edge peak A, Fe white-line peak B and Pt white-line peak C, as well as R-space peak positions of the shells of Fe-O, Fe-Fe, Fe-Pt, Pt-O and Pt-Pt, are also shown; (e) Schematic models of 1cFe-Pt/SiO2-O (left), 1cFe-Pt/SiO2-R (middle) and 1cFe-Pt/SiO2-P (right), Fe, O, H and Pt atoms are shown in orange, red, white, and blue, respectively. (1 Å=0.1 nm) (colorful figures are available on website) ...
... [54]
(a-d) XANES spectra at Fe K edge (a) and Pt L3 edge (b), detailed structural information shown in the k3-weighted FT spectra in R-space at the Fe K edge (c) and the Pt L3 edge (d) (E: energy, R: distance between absorbing atom and neighbouring scatterer atoms, without correcting for scattering phase shift, and χ(k): the amplitude of the EXAFS oscillations as a function of photoelectron wavenumber k (a.u., arbitrary units). The inset in (a) shows a magnified view of the pre-edge peak A. The energy positions of Fe pre-edge peak A, Fe white-line peak B and Pt white-line peak C, as well as R-space peak positions of the shells of Fe-O, Fe-Fe, Fe-Pt, Pt-O and Pt-Pt, are also shown; (e) Schematic models of 1cFe-Pt/SiO2-O (left), 1cFe-Pt/SiO2-R (middle) and 1cFe-Pt/SiO2-P (right), Fe, O, H and Pt atoms are shown in orange, red, white, and blue, respectively. (1 Å=0.1 nm) (colorful figures are available on website) ...
Revealing the atomistic origin of the disorder-enhanced Na-storage performance in NaFePO4 battery cathode
... [55] XAFS spectra of NaFePO<sub>4</sub> and schematic illustrations for Na diffusive mechanism<sup>[<xref ref-type="bibr" rid="b55">55</xref>]</sup>
X-ray absorption near edge structure spectra of Na K-edge (a), O K-edge (b) for olivine-type, maricite-type and polymorphic composites obtained by milling for 15 h (NFP-15); Schematic illustrations for Na diffusive mechanism: possible sodium-ion diffusive pathways and atomistic structure for amorphous NaFePO4 (c), structural sketching diagrams of olivine-type NaFePO4 (d), and maricite-type NaFePO4 (e) Colorful figures are available on website ...
... [55]
X-ray absorption near edge structure spectra of Na K-edge (a), O K-edge (b) for olivine-type, maricite-type and polymorphic composites obtained by milling for 15 h (NFP-15); Schematic illustrations for Na diffusive mechanism: possible sodium-ion diffusive pathways and atomistic structure for amorphous NaFePO4 (c), structural sketching diagrams of olivine-type NaFePO4 (d), and maricite-type NaFePO4 (e) Colorful figures are available on website ...
Thermodynamic activation of charge transfer in anionic redox process for Li-ion batteries
... [57] Fitting of the Fourier transforms of <i>k</i><sup>3</sup> weighted EXAFS oscillations at Se K-edge of SnS<sub>1-</sub><i><sub>x</sub></i>Se<i><sub>x</sub></i><sup>[<xref ref-type="bibr" rid="b57">57</xref>]</sup>
(A) x=0.03; (B) x=0.06; (C) x=0.09; (D) x=0.12 (1 Å=0.1 nm) (colorful figures are available on website) ...
... [57]
(A) x=0.03; (B) x=0.06; (C) x=0.09; (D) x=0.12 (1 Å=0.1 nm) (colorful figures are available on website) ...
... [59] Electronic structure and interfacial interaction of 2D Sn/Bi<sub>2</sub>Te<sub>3</sub> material studied by SR-XRS<sup>[<xref ref-type="bibr" rid="b59">59</xref>]</sup>
(a) Perspective top and side views of atomic structure of stanene/Bi2Te3; (b) ARPES intensity evolution of CE contours in the 2D Brillouin zone at the specified binding energies; (c) XPS results of Bi4f7/2 core levels. The Bi4f7/2 spectra are measured at 500 eV under room temperature (1 Å=0.1 nm) (colorful figures are available on website) ...
... [59]
(a) Perspective top and side views of atomic structure of stanene/Bi2Te3; (b) ARPES intensity evolution of CE contours in the 2D Brillouin zone at the specified binding energies; (c) XPS results of Bi4f7/2 core levels. The Bi4f7/2 spectra are measured at 500 eV under room temperature (1 Å=0.1 nm) (colorful figures are available on website) ...
Defects controlled hole doping and multivalley transport in SnSe single crystals
... [60] Electronic structure of p-SnSe resolved by ARPES<sup>[<xref ref-type="bibr" rid="b60">60</xref>]</sup>
ARPES measures band dispersions along high-symmetry directions of Z-Γ-Z (a), U-Y-U (b), and Y-Γ-Y (c), taken with 50 eV photon energy. The second derivative plots (d) and (e), corresponding to (a) and (b), respectively, directly compared with the DFT calculations, in which the weight of Sn5s and Se4p orbitals are represented by light blue and yellow, respectively; Close-up of the top VBs along Γ-Z reveals pronounced differences between the theoretical band dispersion (f) and the ARPES measured results (g), as highlighted by the X-shaped dashed lines; (h) Schematic plot of a pudding-moul shaped VB with corrugations, which leads to giant S due to the band geometry effect with inset showing the ARPES cut directions in the projected two-dimensional first Brillouin zone (BZ) (1 Å=0.1 nm) ...
... [60]
ARPES measures band dispersions along high-symmetry directions of Z-Γ-Z (a), U-Y-U (b), and Y-Γ-Y (c), taken with 50 eV photon energy. The second derivative plots (d) and (e), corresponding to (a) and (b), respectively, directly compared with the DFT calculations, in which the weight of Sn5s and Se4p orbitals are represented by light blue and yellow, respectively; Close-up of the top VBs along Γ-Z reveals pronounced differences between the theoretical band dispersion (f) and the ARPES measured results (g), as highlighted by the X-shaped dashed lines; (h) Schematic plot of a pudding-moul shaped VB with corrugations, which leads to giant S due to the band geometry effect with inset showing the ARPES cut directions in the projected two-dimensional first Brillouin zone (BZ) (1 Å=0.1 nm) ...
Yellow persistent luminescence and electronic structure of Ca-α-Sialon: Eu2+
... [61] Persistent luminescence properties of CaSi<sub>10-</sub><i><sub>n</sub></i>Al<sub>2+</sub><i><sub>n</sub></i>O<i><sub>n</sub></i>N<sub>16-</sub><i><sub>n</sub></i>:<i>x</i>Eu<sup>2+</sup> material studied by VUV-UV spectra<sup>[<xref ref-type="bibr" rid="b61">61</xref>]</sup>
(a) Excitation and (b) emission spectra of CaSi10Al2N16: xEu (x = 0.1%-8%) samples with inset showing the integral intensity (blue curve) and the Stokes shift (red curve) of those samples against Eu concentration (the sharp peaks in the range of 400-500 nm being caused by the Xe lamp equipped in the FLS 920 spectrophotometer); (c) Emission spectra of CaSi10-nAl2+nOnN16-n: 0.5%Eu (n=0-1) samples with inset showing the integral intensity versus n values (colorful figures are avaailable on websites) ...
... [61]
(a) Excitation and (b) emission spectra of CaSi10Al2N16: xEu (x = 0.1%-8%) samples with inset showing the integral intensity (blue curve) and the Stokes shift (red curve) of those samples against Eu concentration (the sharp peaks in the range of 400-500 nm being caused by the Xe lamp equipped in the FLS 920 spectrophotometer); (c) Emission spectra of CaSi10-nAl2+nOnN16-n: 0.5%Eu (n=0-1) samples with inset showing the integral intensity versus n values (colorful figures are avaailable on websites) ...
Applications of NFPS/SSRF BL01B1 Synchrotron Infrared Beamline Station
2018
Novel developments and applications of nanoscale synchrotron radiation microscopy
... [66] Structural defects and formation process of Zn<sub>4</sub>Si<sub>2</sub>O<sub>7</sub>(OH)<sub>2</sub>·H<sub>2</sub>O particles studied by SR-XRI<sup>[<xref ref-type="bibr" rid="b66">66</xref>]</sup>
(a) SEM image (inset: TEM image); (b) Reconstructed three dimensional rendering view of the urchin-like zinc silicate; (c) Schematic illustration of the preparation of the zinc silicate nanomaterials ...
... [66]
(a) SEM image (inset: TEM image); (b) Reconstructed three dimensional rendering view of the urchin-like zinc silicate; (c) Schematic illustration of the preparation of the zinc silicate nanomaterials ...
Metal segregation in hierarchically structured cathode materials for high-energy lithium batteries
... [67] 3D element distribution of particles analyzed by X-ray tomography technique<sup>[<xref ref-type="bibr" rid="b67">67</xref>]</sup>
Elemental association maps of the as-made NMC precursor after spray pyrolysis (a,b) and the powder after annealing at 850 ℃ (c,d); 3D rendering of the elemental associations viewing the particles at different angles (a,c); 2D slices of the elemental associations cut through at different depths of the imaged particles (b,d). The colours representing the elemental associations are shown at the bottom ...
... [67]
Elemental association maps of the as-made NMC precursor after spray pyrolysis (a,b) and the powder after annealing at 850 ℃ (c,d); 3D rendering of the elemental associations viewing the particles at different angles (a,c); 2D slices of the elemental associations cut through at different depths of the imaged particles (b,d). The colours representing the elemental associations are shown at the bottom ...
Mesoscale battery science: the behavior of electrode particles caught on a multispectral X-ray camera
... Elemental association maps of the as-made NMC precursor after spray pyrolysis (a,b) and the powder after annealing at 850 ℃ (c,d); 3D rendering of the elemental associations viewing the particles at different angles (a,c); 2D slices of the elemental associations cut through at different depths of the imaged particles (b,d). The colours representing the elemental associations are shown at the bottom Fig. 18
3D distributions of chemical components and valence states of LiNi<sub>0.4</sub>Mn<sub>0.4</sub>Co<sub>0.2</sub>O<sub>2</sub> battery particles studied by X-ray spectro-microscopy<sup>[<xref ref-type="bibr" rid="b68">68</xref>]</sup>
(a) Panel illustrating the data structure; (b) Panel showing the prior knowledge of a list of anticipated principal chemical species in the sample, which is indispensable for the chemical mapping in this approach. Panel (c) illustrates the quantification procedures including the linear combination fitting, the color coding, and the tomographic reconstruction. Panel (d) shows the 3D mesoscale structural and chemical heterogeneity of a cluster of partially reduced NiO electrode particles ...
... [68]
(a) Panel illustrating the data structure; (b) Panel showing the prior knowledge of a list of anticipated principal chemical species in the sample, which is indispensable for the chemical mapping in this approach. Panel (c) illustrates the quantification procedures including the linear combination fitting, the color coding, and the tomographic reconstruction. Panel (d) shows the 3D mesoscale structural and chemical heterogeneity of a cluster of partially reduced NiO electrode particles ...
Simultaneous quick measurements of combined synchrotron EDXAFS and EDXRD


