), 郭乐2, 丁嘉仪2, 周嘉琪1, 张学良1, 努尔尼沙·阿力甫1()
), GUO Le2, DING Jiayi2, ZHOU Jiaqi1, ZHANG Xueliang1, NUERNISHA Alifu1()
), 郭乐2, 丁嘉仪2, 周嘉琪1, 张学良1, 努尔尼沙·阿力甫1()
), GUO Le2, DING Jiayi2, ZHOU Jiaqi1, ZHANG Xueliang1, NUERNISHA Alifu1()
图6. 免疫荧光标记细胞的超分辨成像[
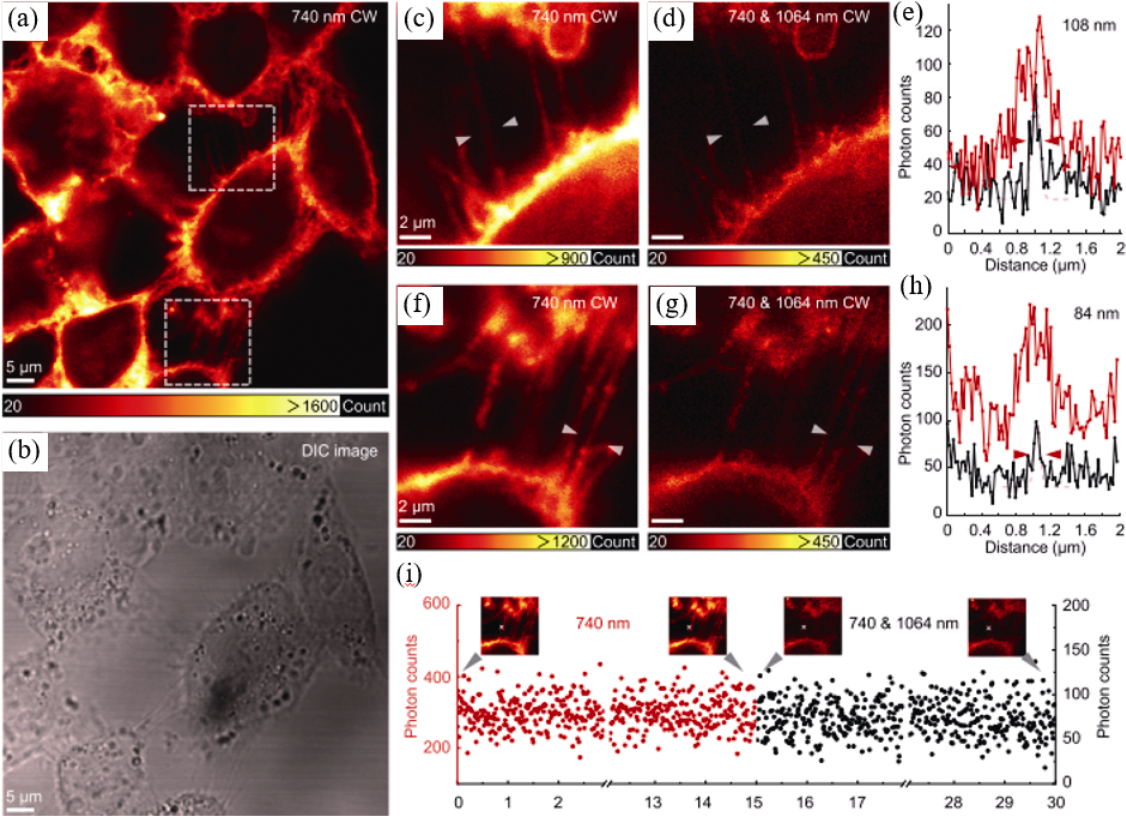
Fig. 6. STExD (stimulated-emission induced excitation depletion) imaging of immunolabelled subcellular filaments[
(a) Fluorescence image under 740 nm Gaussian beam excitation and (b) differential interference contrast image of actin protein in HeLa cells immunolabeled with phalloidin conjugated NaYF4: Nd nanoparticles; (c, f) Magnified areas and (d, g) super-resolution images under co-irradiation with 740 nm Gaussian beam and 1064 nm donut-shaped beam from white-dotted squares in (a); (e, h) Analyses of line profiles, indicated with white arrows in (c, d), as well as in (f, g), respectively; (i) Photon counts recorded with and without co-irradiation of 1064 nm donut-shaped beam with insets showing the corresponding images with the measured positions marked with white crosses