PZT陶瓷本构行为与断裂性能的相关性研究
王雪瑶1( ), 王武港2, 李应卫1(), 彭奇1, 梁瑞虹2()
), 王武港2, 李应卫1(), 彭奇1, 梁瑞虹2()
Correlation between Constitutive Behavior and Fracture Performance of PZT Ceramics
WANG Xueyao1(), WANG Wugang2, LI Yingwei1(), PENG Qi1, LIANG Ruihong2()
), WANG Wugang2, LI Yingwei1(), PENG Qi1, LIANG Ruihong2()
.
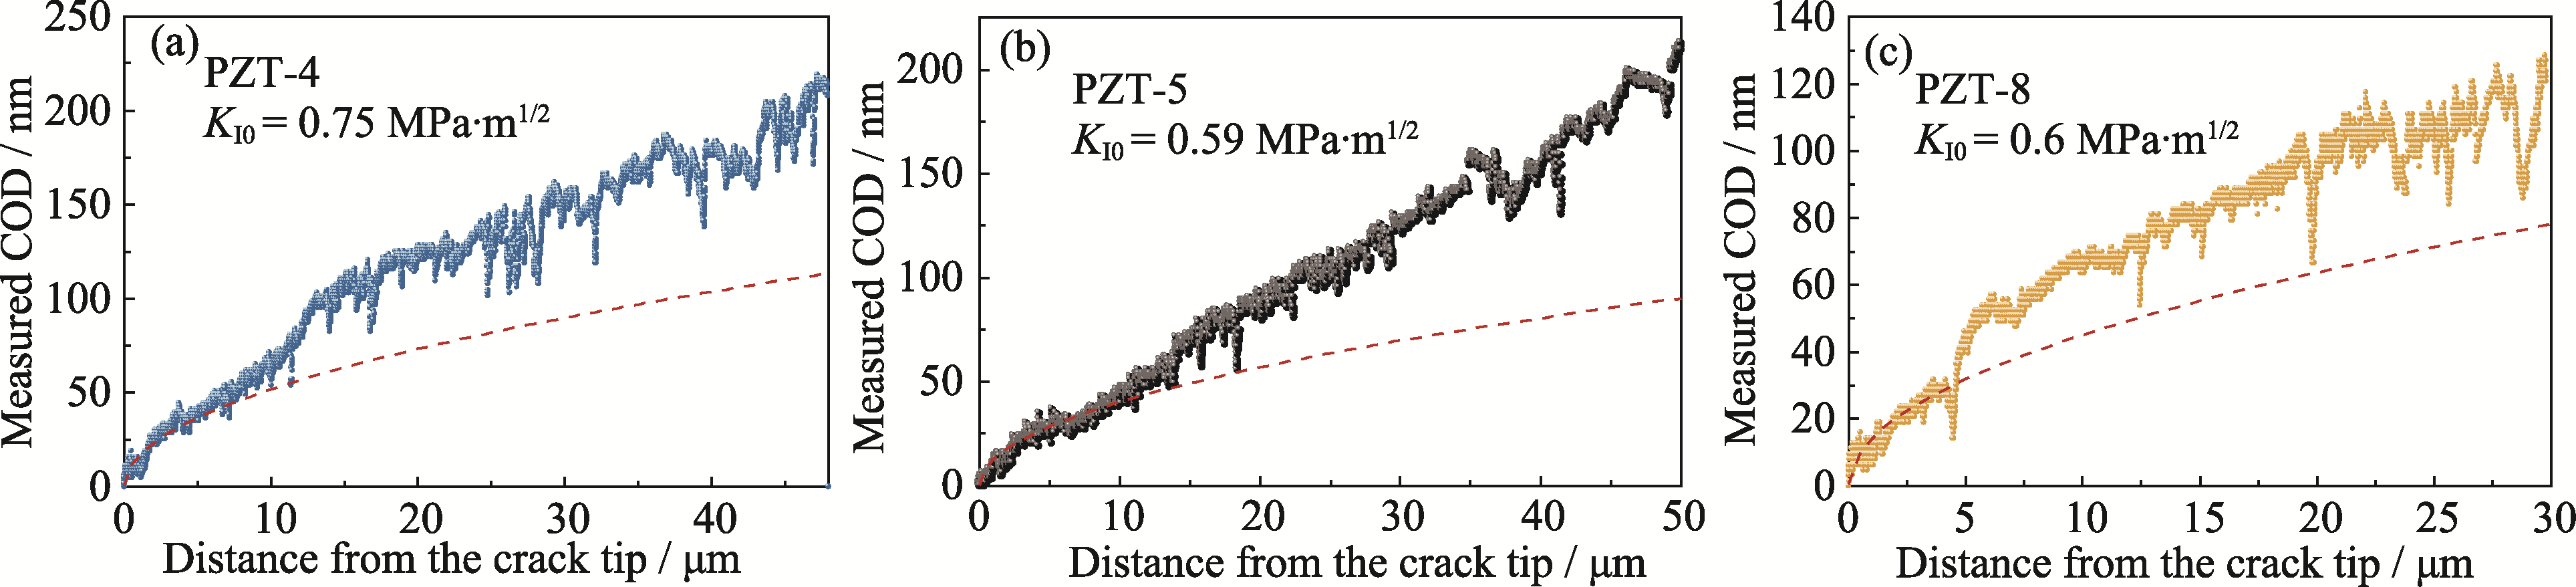
Fig. S1. COD profiles for (a) PZT-4, (b) PZT-5, and (c) PZT-8
The Irwin parabola is represented by the red line