), 刘佃光1(), 王珂玮2, 马百胜2, 刘金铃3
), LIU Dianguang1(), WANG Kewei2, MA Baisheng2, LIU Jinling3
), 刘佃光1(), 王珂玮2, 马百胜2, 刘金铃3
), LIU Dianguang1(), WANG Kewei2, MA Baisheng2, LIU Jinling3
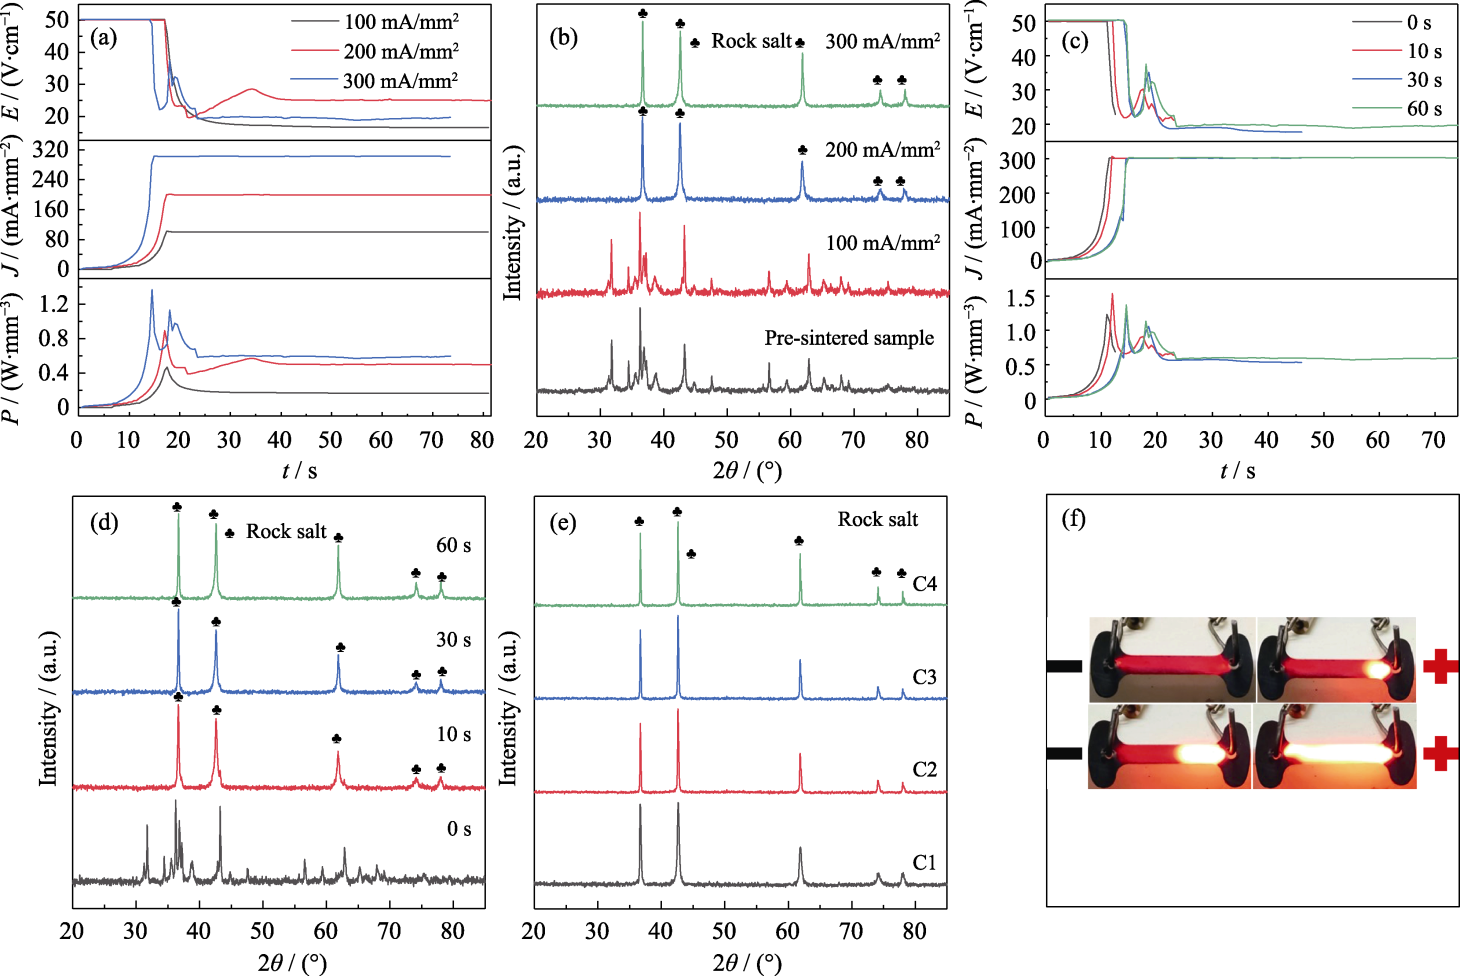
图1. 不同条件下的闪烧曲线、闪烧样品和传统烧结样品的XRD图谱以及闪烧样品保温阶段的照片
Fig. 1. Flash sintering curves, XRD patterns of samples and pictures of flash sintered sample in the stable stage
Flash sintering curves (a) and XRD patterns at room temperature (b) of samples flash sintered at electric field strength of 50 V/cm, holding time of 60 s, and current densities of 100, 200 and 300 mA/mm2, respectively; Flash sintering curves (c) and XRD patterns at room temperature (d) of samples flash sintered at electric field strength of 50 V/cm, current density of 300 mA/mm2, holding time of 0, 10, 30, 60 s; (e) XRD patterns of conventional sintered samples C1-C4; (f) Photos of flash sintered samples in the stable stage; The holding time referrs to the time during the stable stage of flash sintering; Colorful figures are available on website